The image below shows the clean image composed of three grayscale values. The corresponding probability distribution function (PDF) of the gray levels of the clean image is also shown together with the image.

Figure 1. Clean image and its PDF
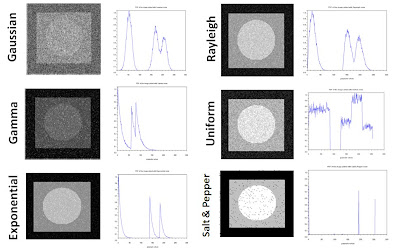
Figure 2. Different noise models applied to the clean image
In order to improve the quality of the degraded image brought by the added noise, spatial filtering method is employed. The different filters that are utilized in this activity are as follows.
Arithmetic Mean Filter (AMF)
In this method, a window S_xy with dimensions m x n and centered at point (x,y) from the corrupted image g(x,y) is selected and the average values of g(x,y) in the area of the window is computed. This can be expressed mathematically as:
where f(x,y) is the restored image.
Geometric Mean Filter (GMF)
This filter is used by implementing the following formula for computing the restore image f(x,y).
Harmonic Mean Filter (HMF)

Figure 3. Restoration of image with Gaussian noise

Figure 4. PDF of the restored image contaminated with Gaussian noise
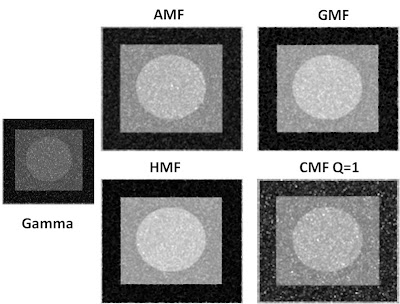
Figure 5. Restoration of image with Gamma noise

Figure 6. PDF of the restored image contaminated with Gamma noise
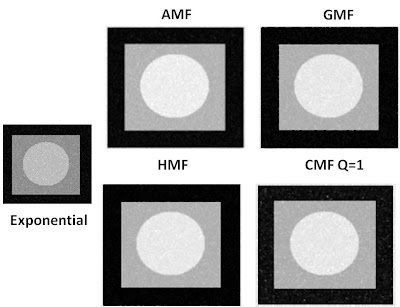
Figure 7. Restoration of image with Exponential noise

Figure 8. PDF of the restored image contaminated with Exponential noise

Figure 9. Restoration of image with Uniform noise

Figure 10. PDF of the restored image contaminated with Uniform noise

Figure 11. Restoration of image with Rayleigh noise

Figure 12. PDF of the restored image contaminated with Rayleigh noise

Figure 13. Restoration of image with Salt and Pepper noise

Figure 14. PDF of the restored image contaminated with Salt and Pepper noise

Figure 15. Restoration of image contaminated with salt and pepper noise using CMF at different Q.

Figure 16. PDF of the restored image after using CMF at different Q
The different noise models that are applied to the image above are as follows:
1. Gaussian noise
This model is also known as the normal noise model from which the PDF is given by:
where z is the gray level value, is the average, and
  is the standard deviation.
2. Gamma/Erlang noise
This model has a PDF equal to:
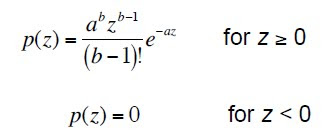

1. Gaussian noise
This model is also known as the normal noise model from which the PDF is given by:
where z is the gray level value,
 is the average, and
  is the standard deviation.
2. Gamma/Erlang noise
This model has a PDF equal to:

and the mean and variance are given by:

and the mean and variance of the density are:
4. Rayleigh noise model
The PDF of the Rayleigh noise model is given by:
and the mean and variance are determine using the equations:
5. Uniform noise model
To determine the PDF, mean, and variance of this model, the following equations are used.
6. Impulse (Salt and Pepper) noise model
The PDF of this model is:
These noise models were simulated using the "grand" function available in Scilab programming language. The effect of the different noise model on the clean image is investigated and shown in Figure 2. Notice from the PDF of the different noise models that the graylevels of the image which were supposedly consisting of only three values become broad and occupied other graylevel values. Depending on the parameters of the noise model, the width of the broadening can be varied. From Figure 2, it can also be noticed that after adding a uniform noise to the image, the graylevels become very large in range such that the values from ~125 to 255 were covered.

Figure 2. Different noise models applied to the clean image
In order to improve the quality of the degraded image brought by the added noise, spatial filtering method is employed. The different filters that are utilized in this activity are as follows.
Arithmetic Mean Filter (AMF)
In this method, a window S_xy with dimensions m x n and centered at point (x,y) from the corrupted image g(x,y) is selected and the average values of g(x,y) in the area of the window is computed. This can be expressed mathematically as:
where f(x,y) is the restored image.
Geometric Mean Filter (GMF)
This filter is used by implementing the following formula for computing the restore image f(x,y).
Harmonic Mean Filter (HMF)
To restore the corrupted image brought by the addition of noise, this filter is employed by following the formula:
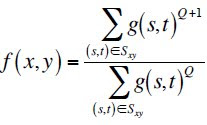
Contraharmonic Mean Filter (CMF)
This filter works by using the expression:
Contraharmonic Mean Filter (CMF)
This filter works by using the expression:

where Q is the order of the filter. Different values of Q yields the removal of either salt or pepper noise and it cannot eliminate both the salt and pepper at the same time.
By implementing the formula given for every filter, the corrupted images after adding the different noise models were restored and shown in the figures below together with the PDF of the restored images.
By implementing the formula given for every filter, the corrupted images after adding the different noise models were restored and shown in the figures below together with the PDF of the restored images.

Figure 3. Restoration of image with Gaussian noise

Figure 4. PDF of the restored image contaminated with Gaussian noise
From the restored images and their corresponding PDF, Gaussian noise was partially eliminated. From the originally very noisy image, the different filters showed an enhancement of the image quality. By observing the PDF of the restored images after using the 4 filters discussed above, it can be seen that the graylevels of the image became narrower in range. However, the initially white part of the image was converted to some other grays values.

Figure 5. Restoration of image with Gamma noise

Figure 6. PDF of the restored image contaminated with Gamma noise
After applying the different filters on the image contaminated with Gamma noise, the characteristic of the image became better in such a manner that the PDF showed three peaks with graylevel values close to the original image. Among the four filters, contraharmonic filter exhibit the worst restoration because the corresponding PDF of the image which was treated still showed a broad graylevel values. This can be further improved by trying other values for Q.

Figure 7. Restoration of image with Exponential noise

Figure 8. PDF of the restored image contaminated with Exponential noise
For the exponential noise that was added to the image, the four filters were shown to be effective in restoring the originally uncontaminated image. However, observing the PDF of the image treated with an arithmetic mean filter, there is an appearance of other peaks aside from the three high peaks.

Figure 9. Restoration of image with Uniform noise

Figure 10. PDF of the restored image contaminated with Uniform noise

Figure 11. Restoration of image with Rayleigh noise

Figure 12. PDF of the restored image contaminated with Rayleigh noise
The restoration of the image with uniform and rayleigh noise was also successfully done the four spatial filters. By comparing the PDF of the initially very noisy image when uniform noise is added and the PDF after applying the filter, we can see that there is a large improvement on the quality of the image.
For the salt and pepper noise added to the image, it can be seen that contraharmonic mean filter works best among the four filters. Further investigation was done when this filter is applied for different Q. In order to evaluate the mechanism of the filter for every Q, I used four values of Q, from -2 to +2 with an increment of 1 and applied CMF to the image contaminated with salt and pepper noise. The corresponding images with their PDF are shown in Figures 15 and 16.
For the salt and pepper noise added to the image, it can be seen that contraharmonic mean filter works best among the four filters. Further investigation was done when this filter is applied for different Q. In order to evaluate the mechanism of the filter for every Q, I used four values of Q, from -2 to +2 with an increment of 1 and applied CMF to the image contaminated with salt and pepper noise. The corresponding images with their PDF are shown in Figures 15 and 16.

Figure 13. Restoration of image with Salt and Pepper noise

Figure 14. PDF of the restored image contaminated with Salt and Pepper noise

Figure 15. Restoration of image contaminated with salt and pepper noise using CMF at different Q.

Figure 16. PDF of the restored image after using CMF at different Q
From the plots above, notice that if Q is negative, salt noise is eliminated while for positive Q, pepper noise is removed.
The different noise model and spatial filters for image restoration are again utilized for another image and the results are shown below.


The different noise model and spatial filters for image restoration are again utilized for another image and the results are shown below.


For this activity, I was able to show the different noise models and their effects on the image as well as the image restoration using the discussed spatial filters. Since the objective of the experiment was met, I give myself a grade of 10.
Reference:
"Noise model and basic image restoration", Applied physics 186 Activity 18 Handout
image: http://www.inhabitat.com/wp-content/uploads/fostergianttower.jpg
Reference:
"Noise model and basic image restoration", Applied physics 186 Activity 18 Handout
image: http://www.inhabitat.com/wp-content/uploads/fostergianttower.jpg


Very informative post. Thanks for sharing.
ReplyDeleteRegards,
photoshop restoration and retouching